Evolution is a leading provider of healthcare services in New Zealand. Our group has six hospitals, five specialist day hospitals, a maternity hospital, and a range of specialist health and wellbeing services.
At Evolution Healthcare, we’re driven to provide continuing excellence in the health and wellbeing of the people in our care.
About Us
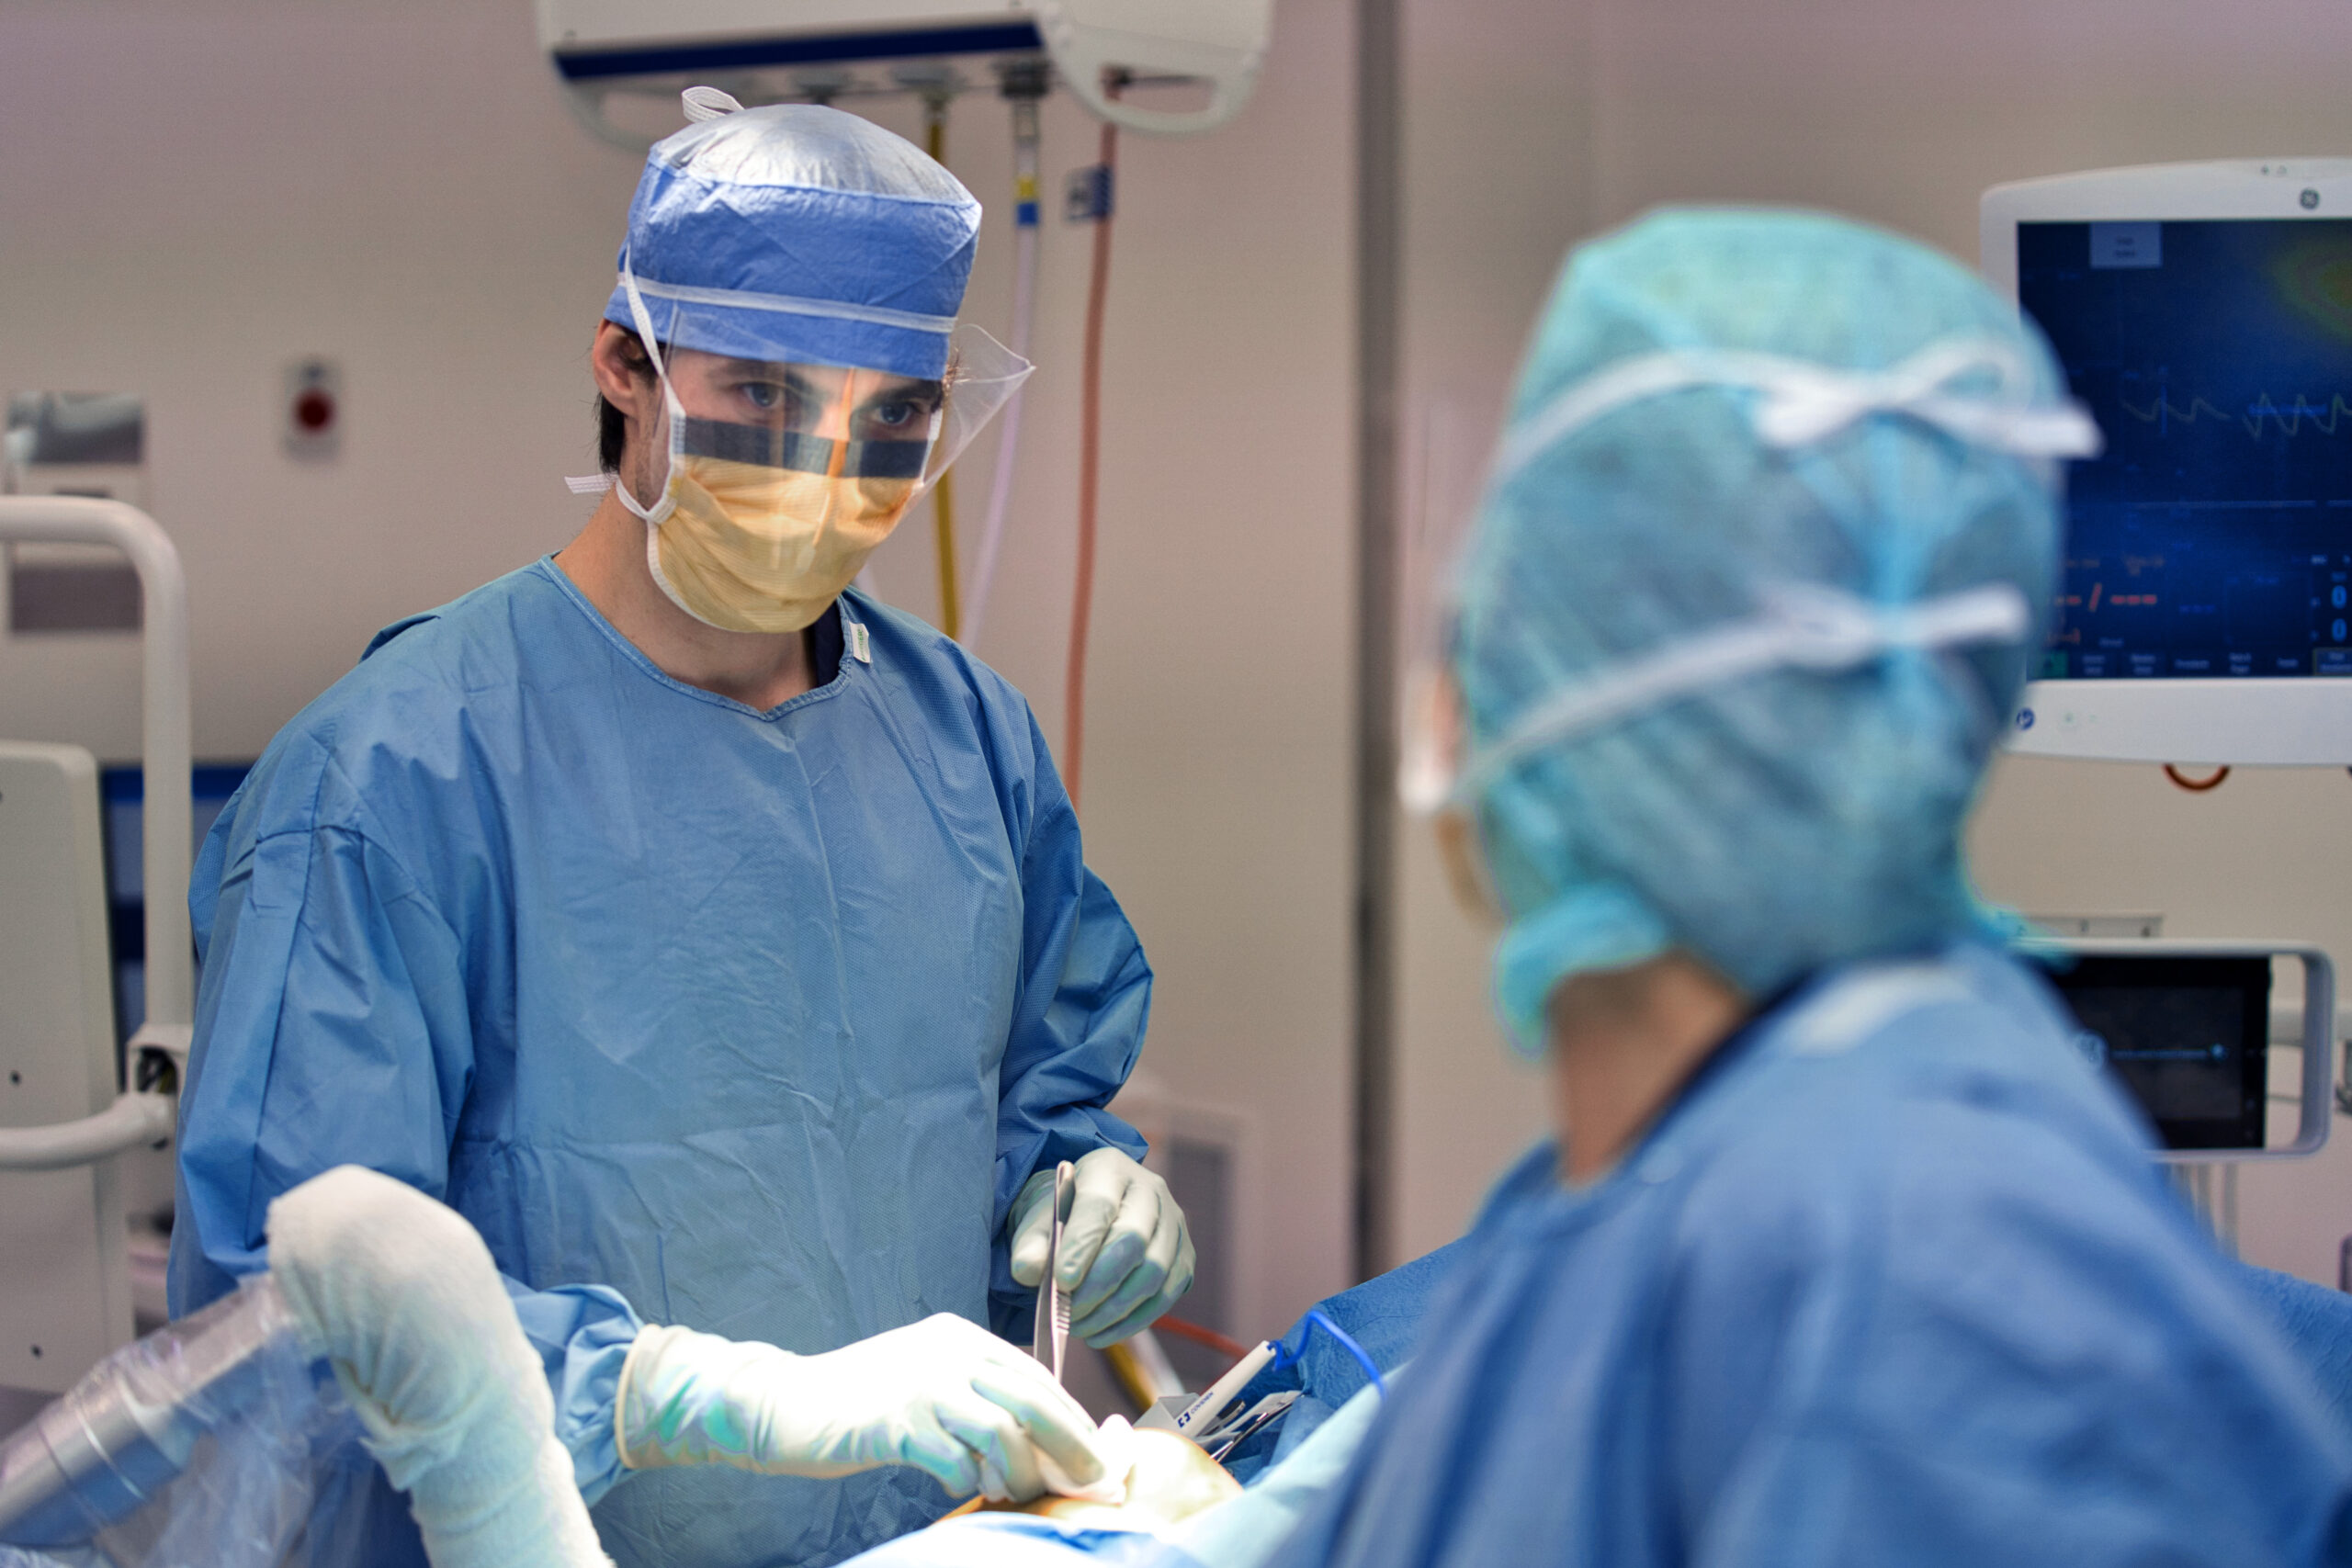
Evolution Healthcare as a group has a wide range of private surgical and related healthcare services in New Zealand. Ranked by the people in our care, our private hospitals showcase the very highest quality standards of care.
30 March
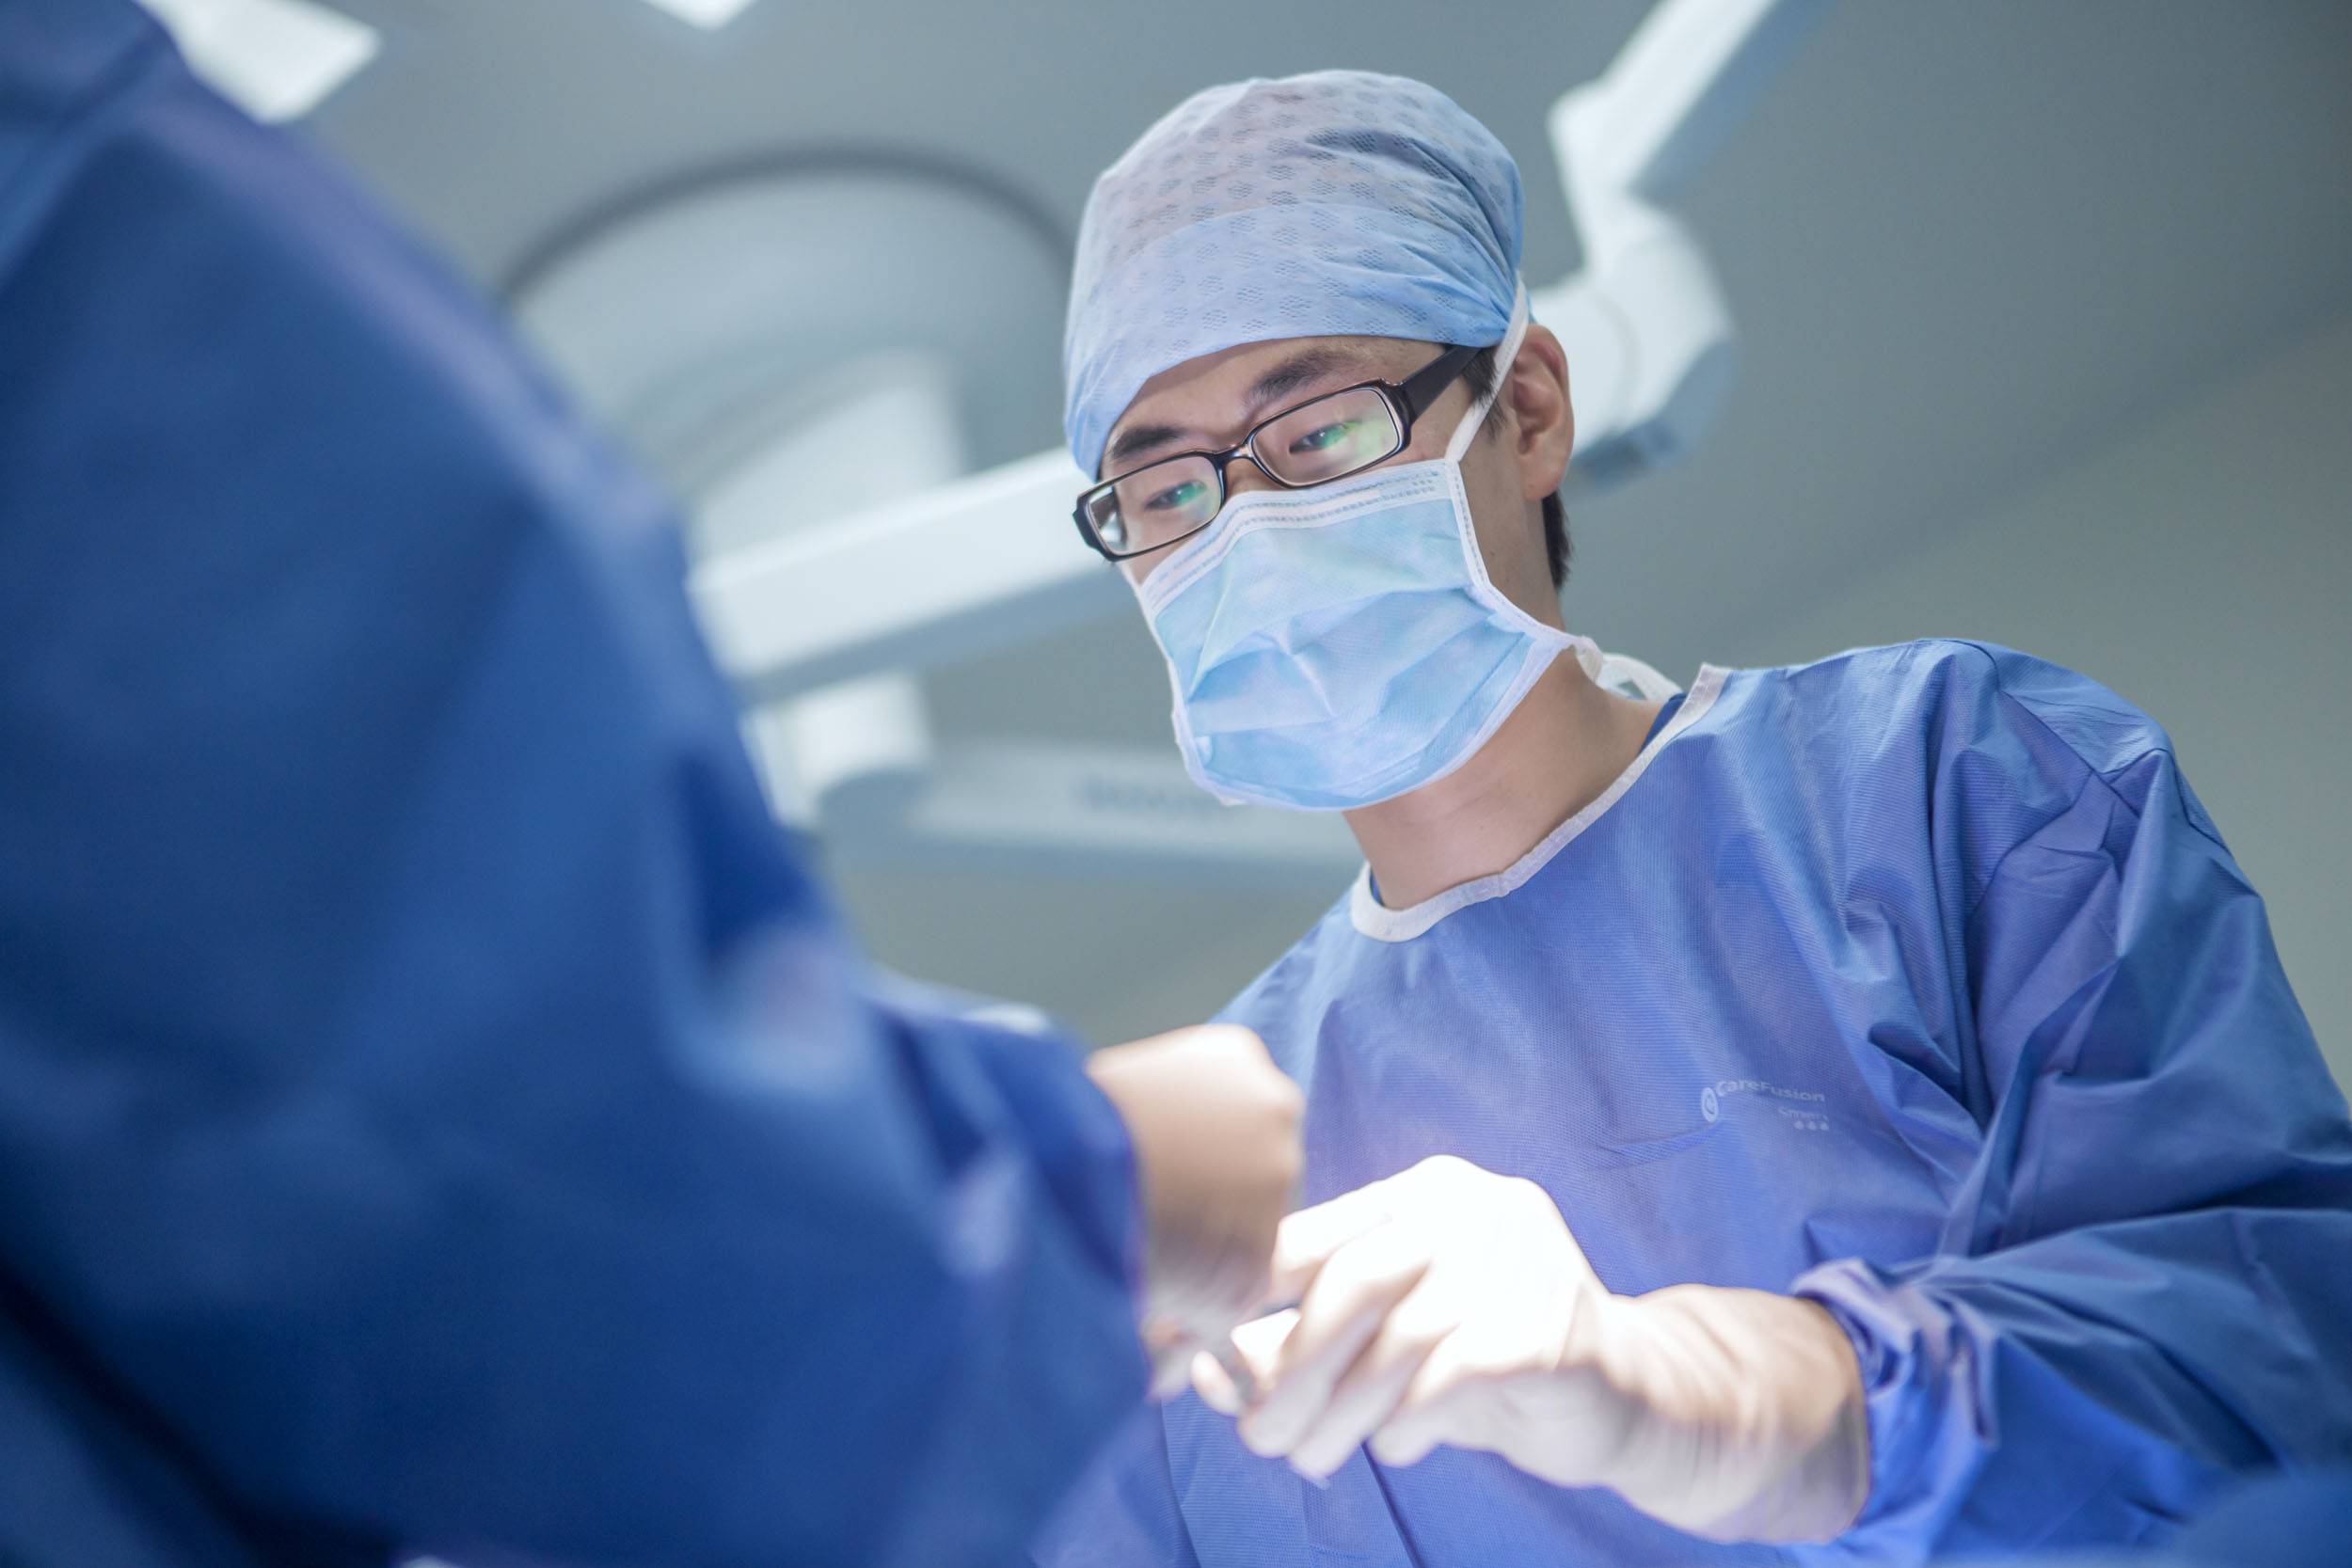
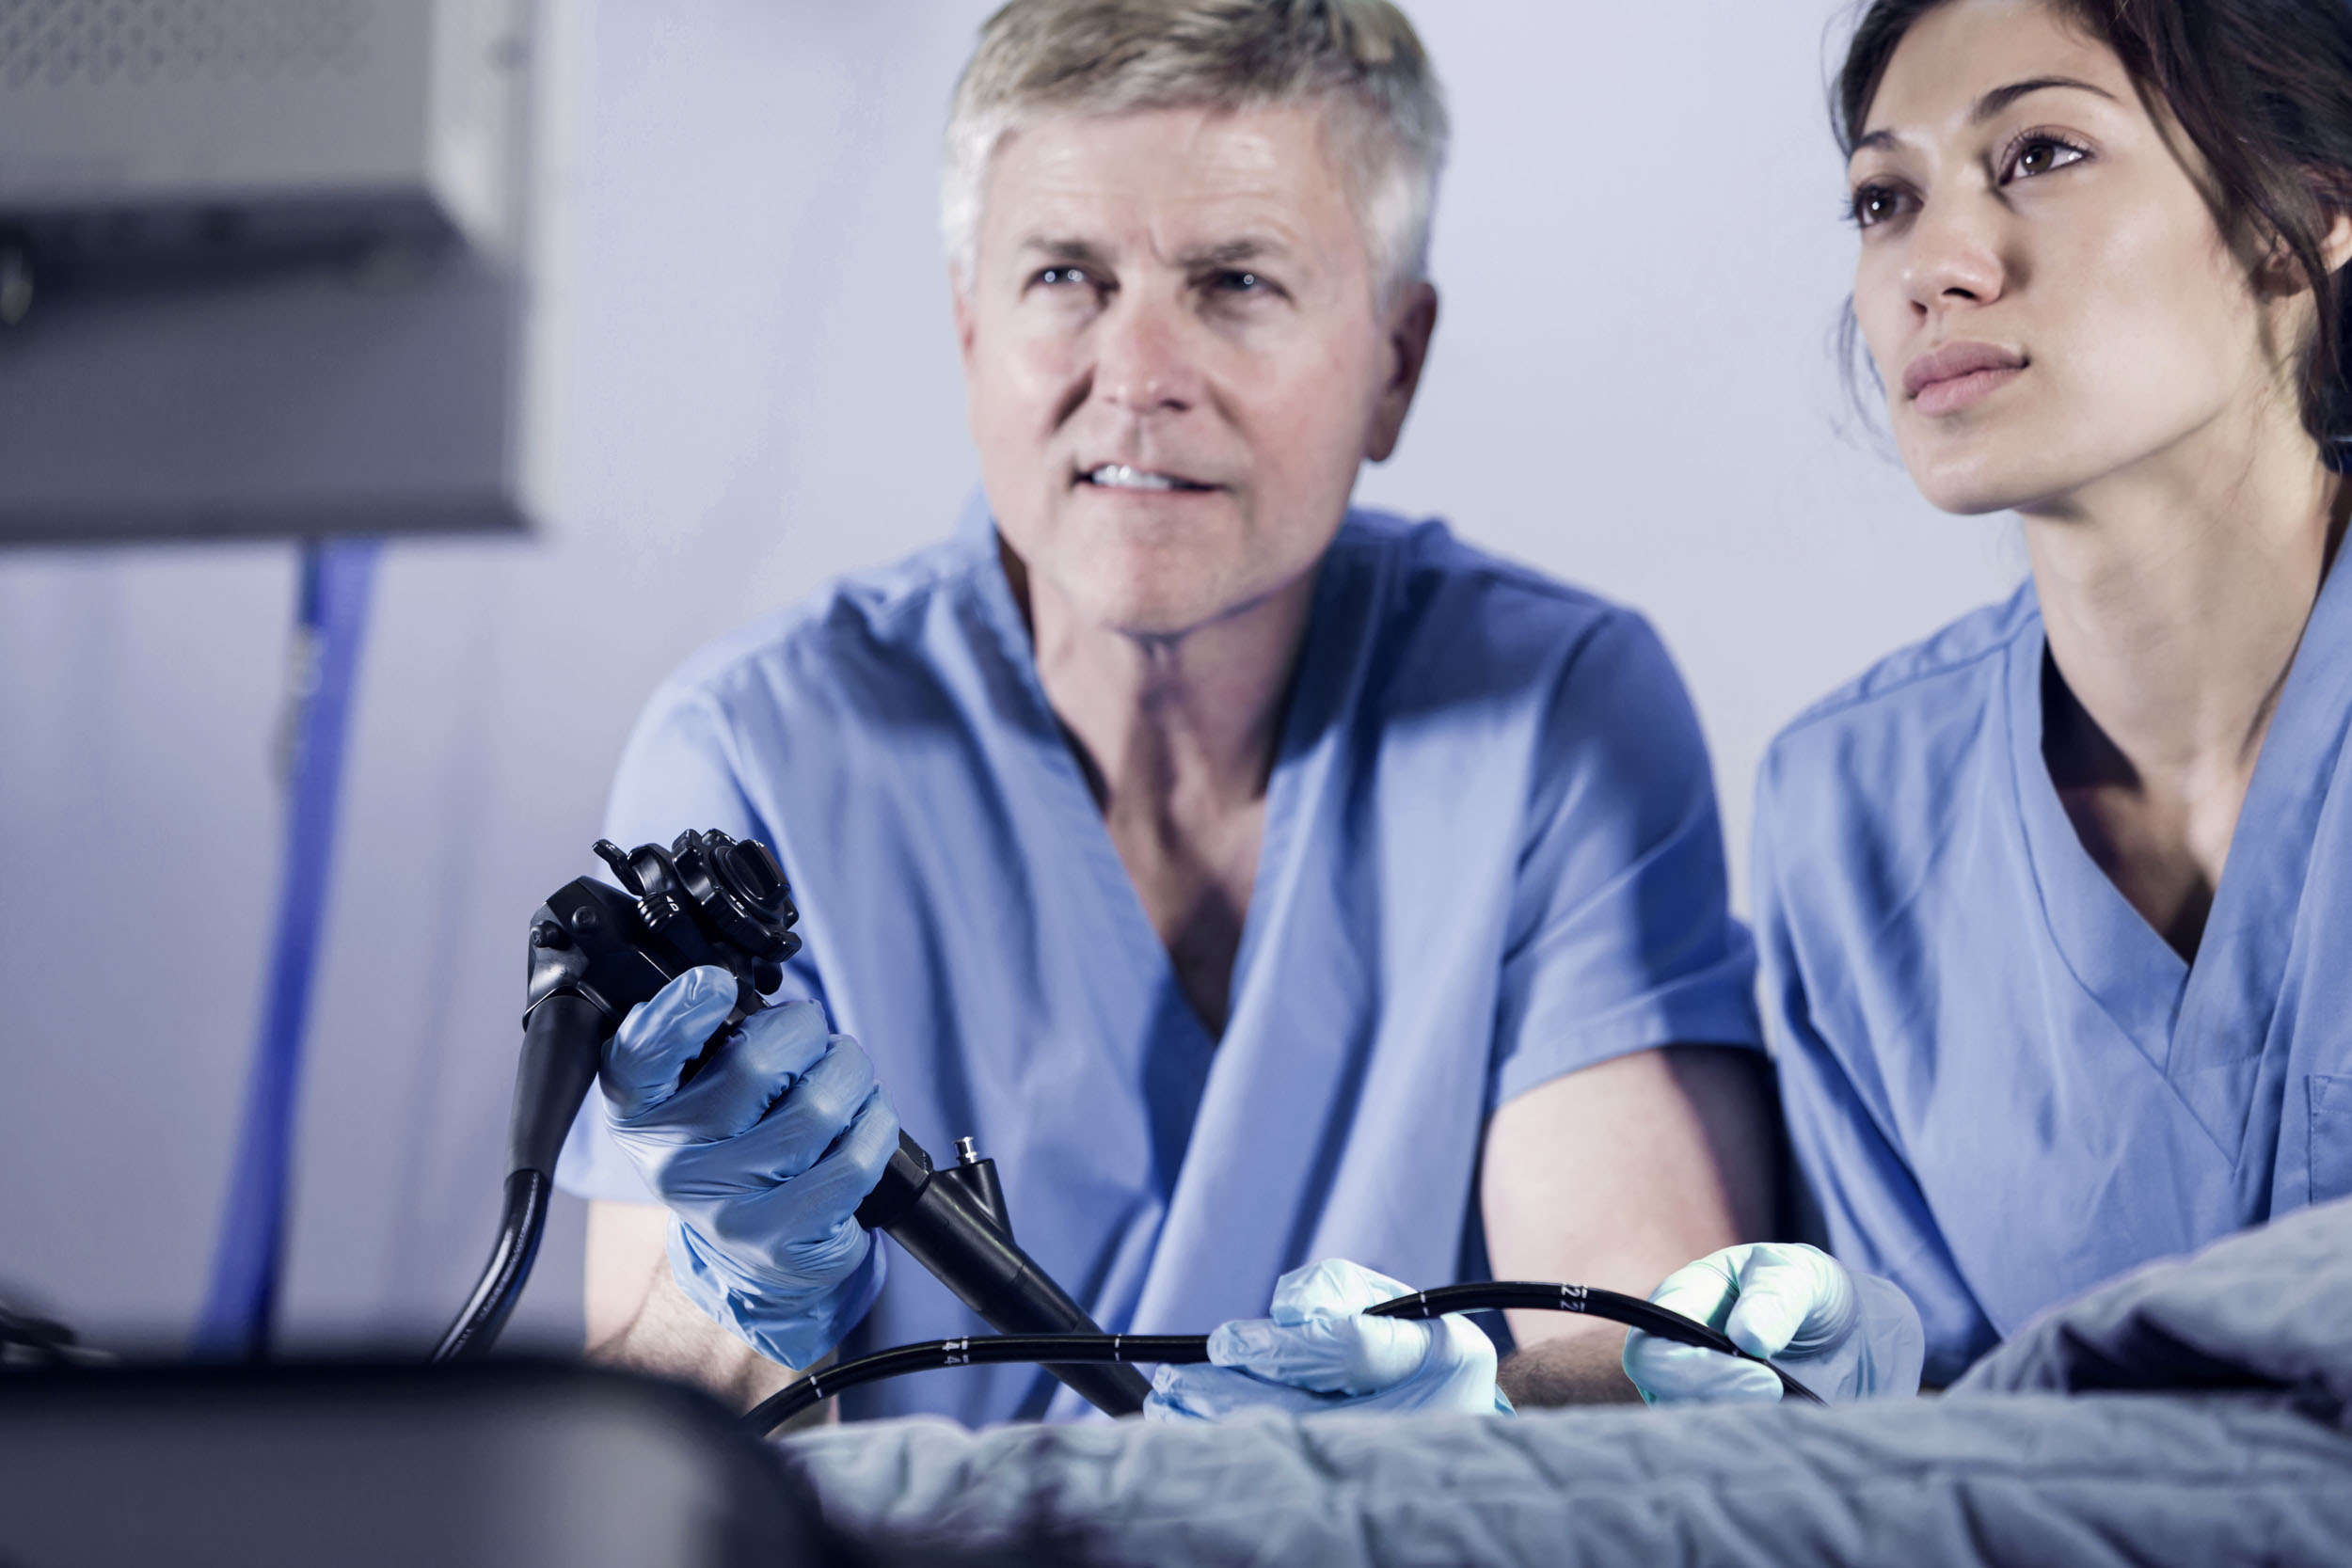
Let’s give a round of applause to the real-life heroes in white coats! This National Doctors’ Day, we’re tipping our hats to the incredible doctors who dedicate their lives to healing and caring for others. Evolution Healthcare is honoured to work alongside these exceptional professionals who entrust their patients’ well-being to our facilities and services.
Read more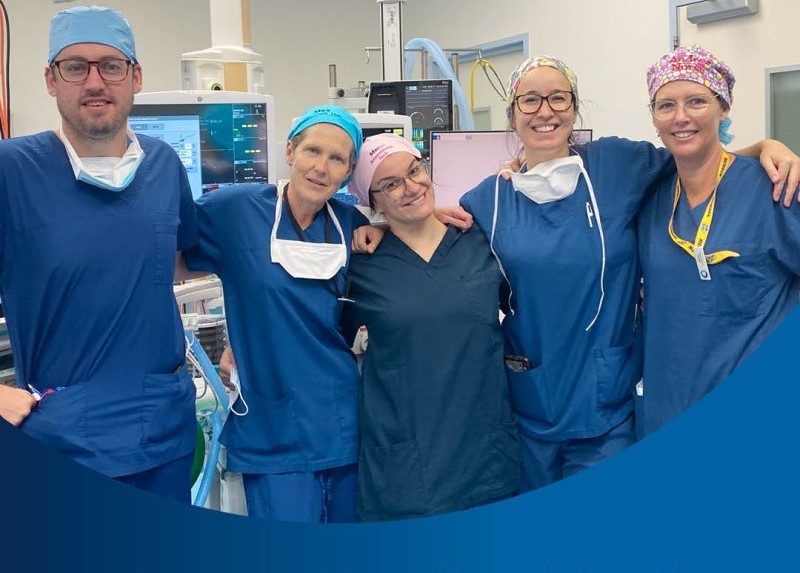
12 March
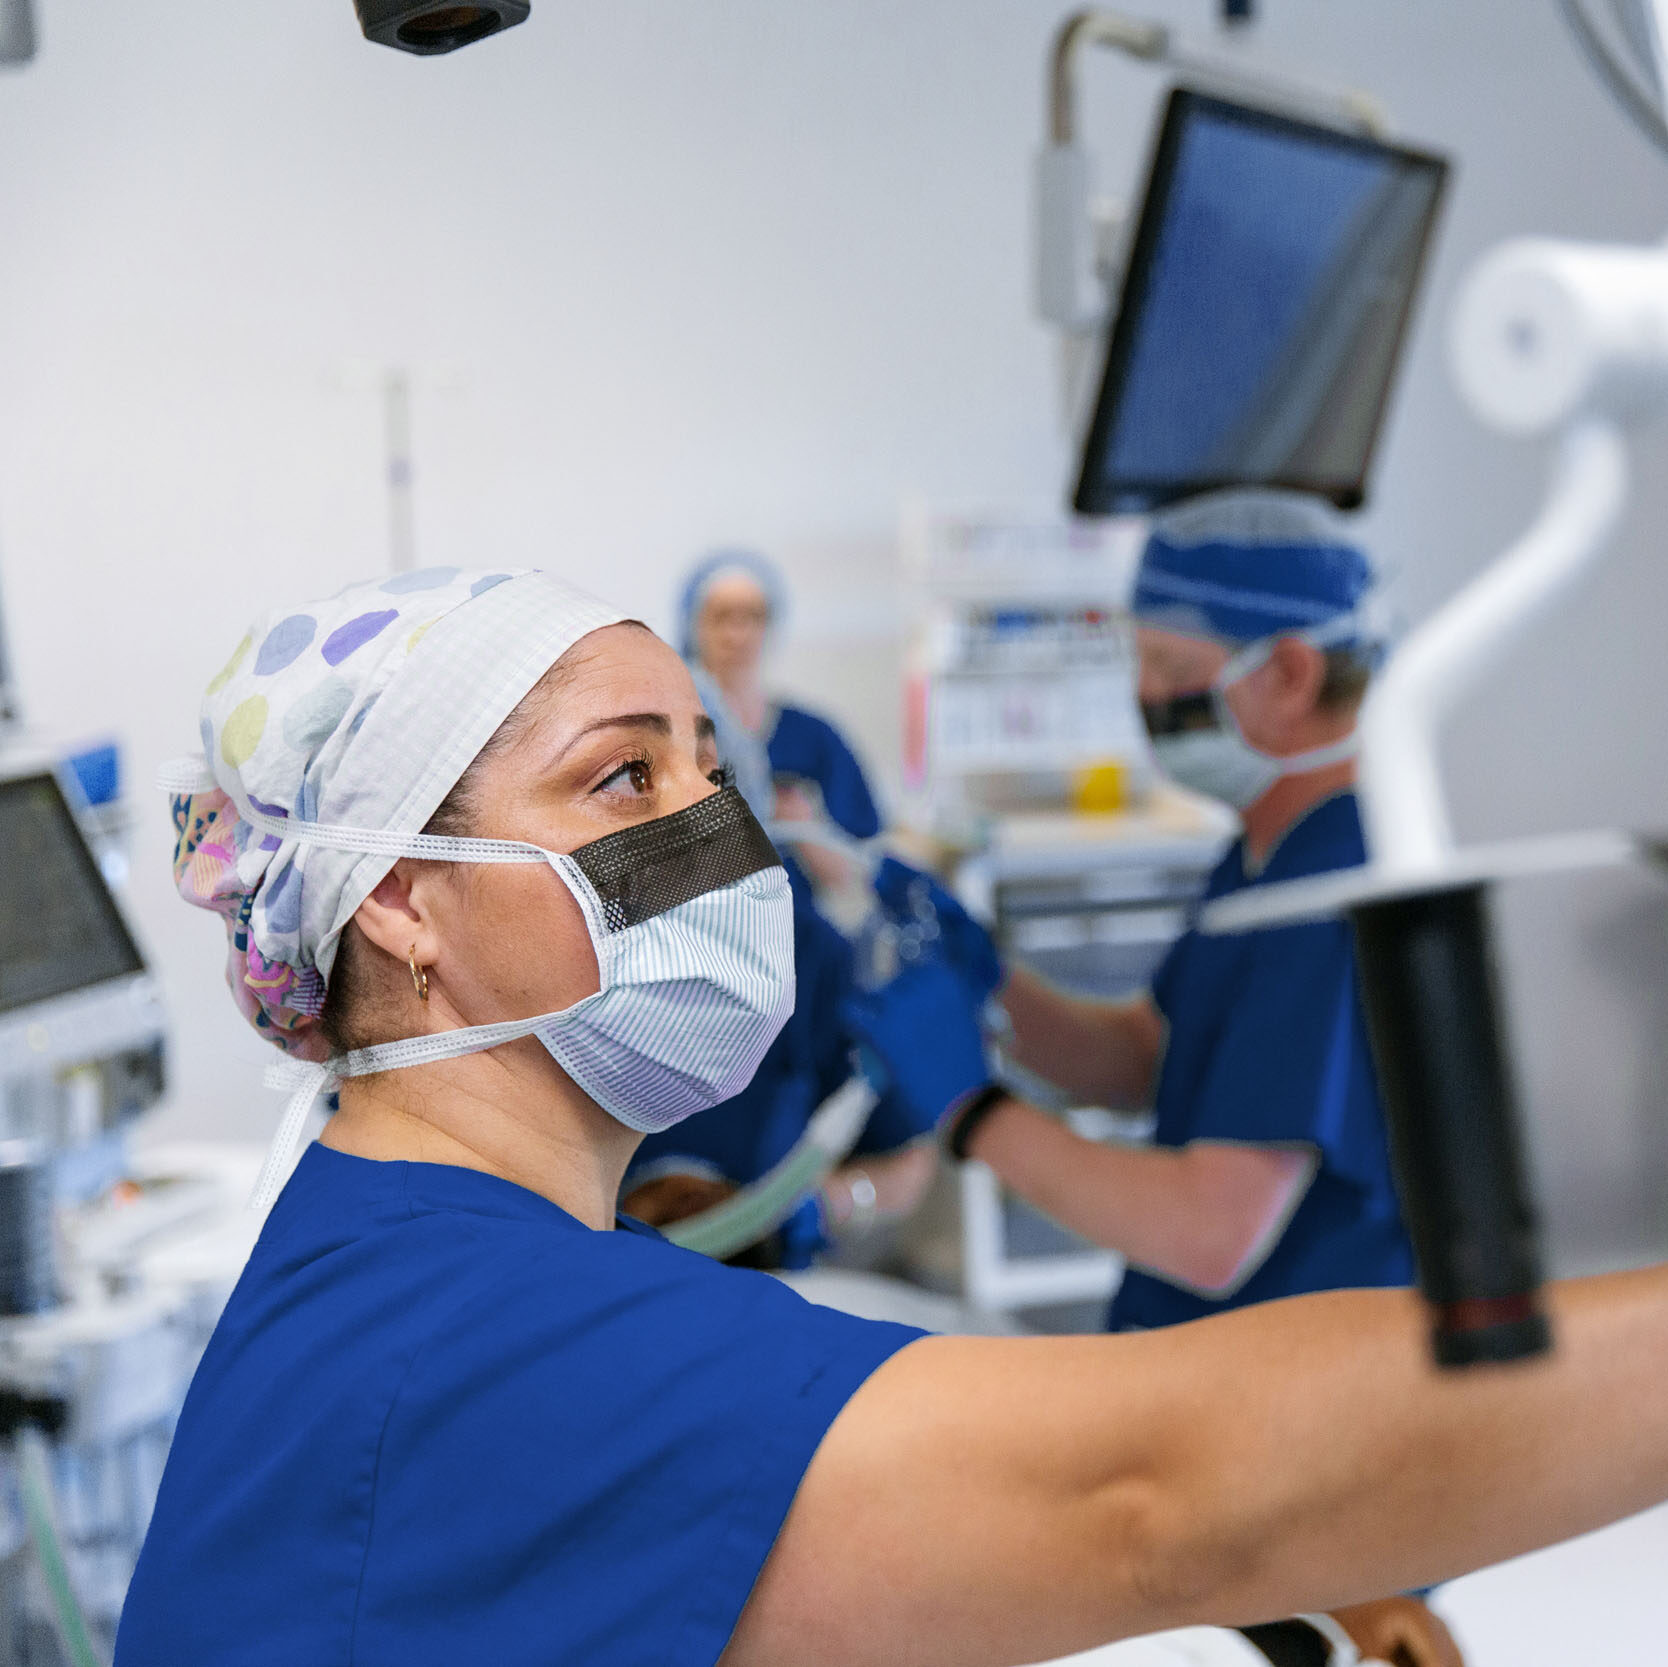
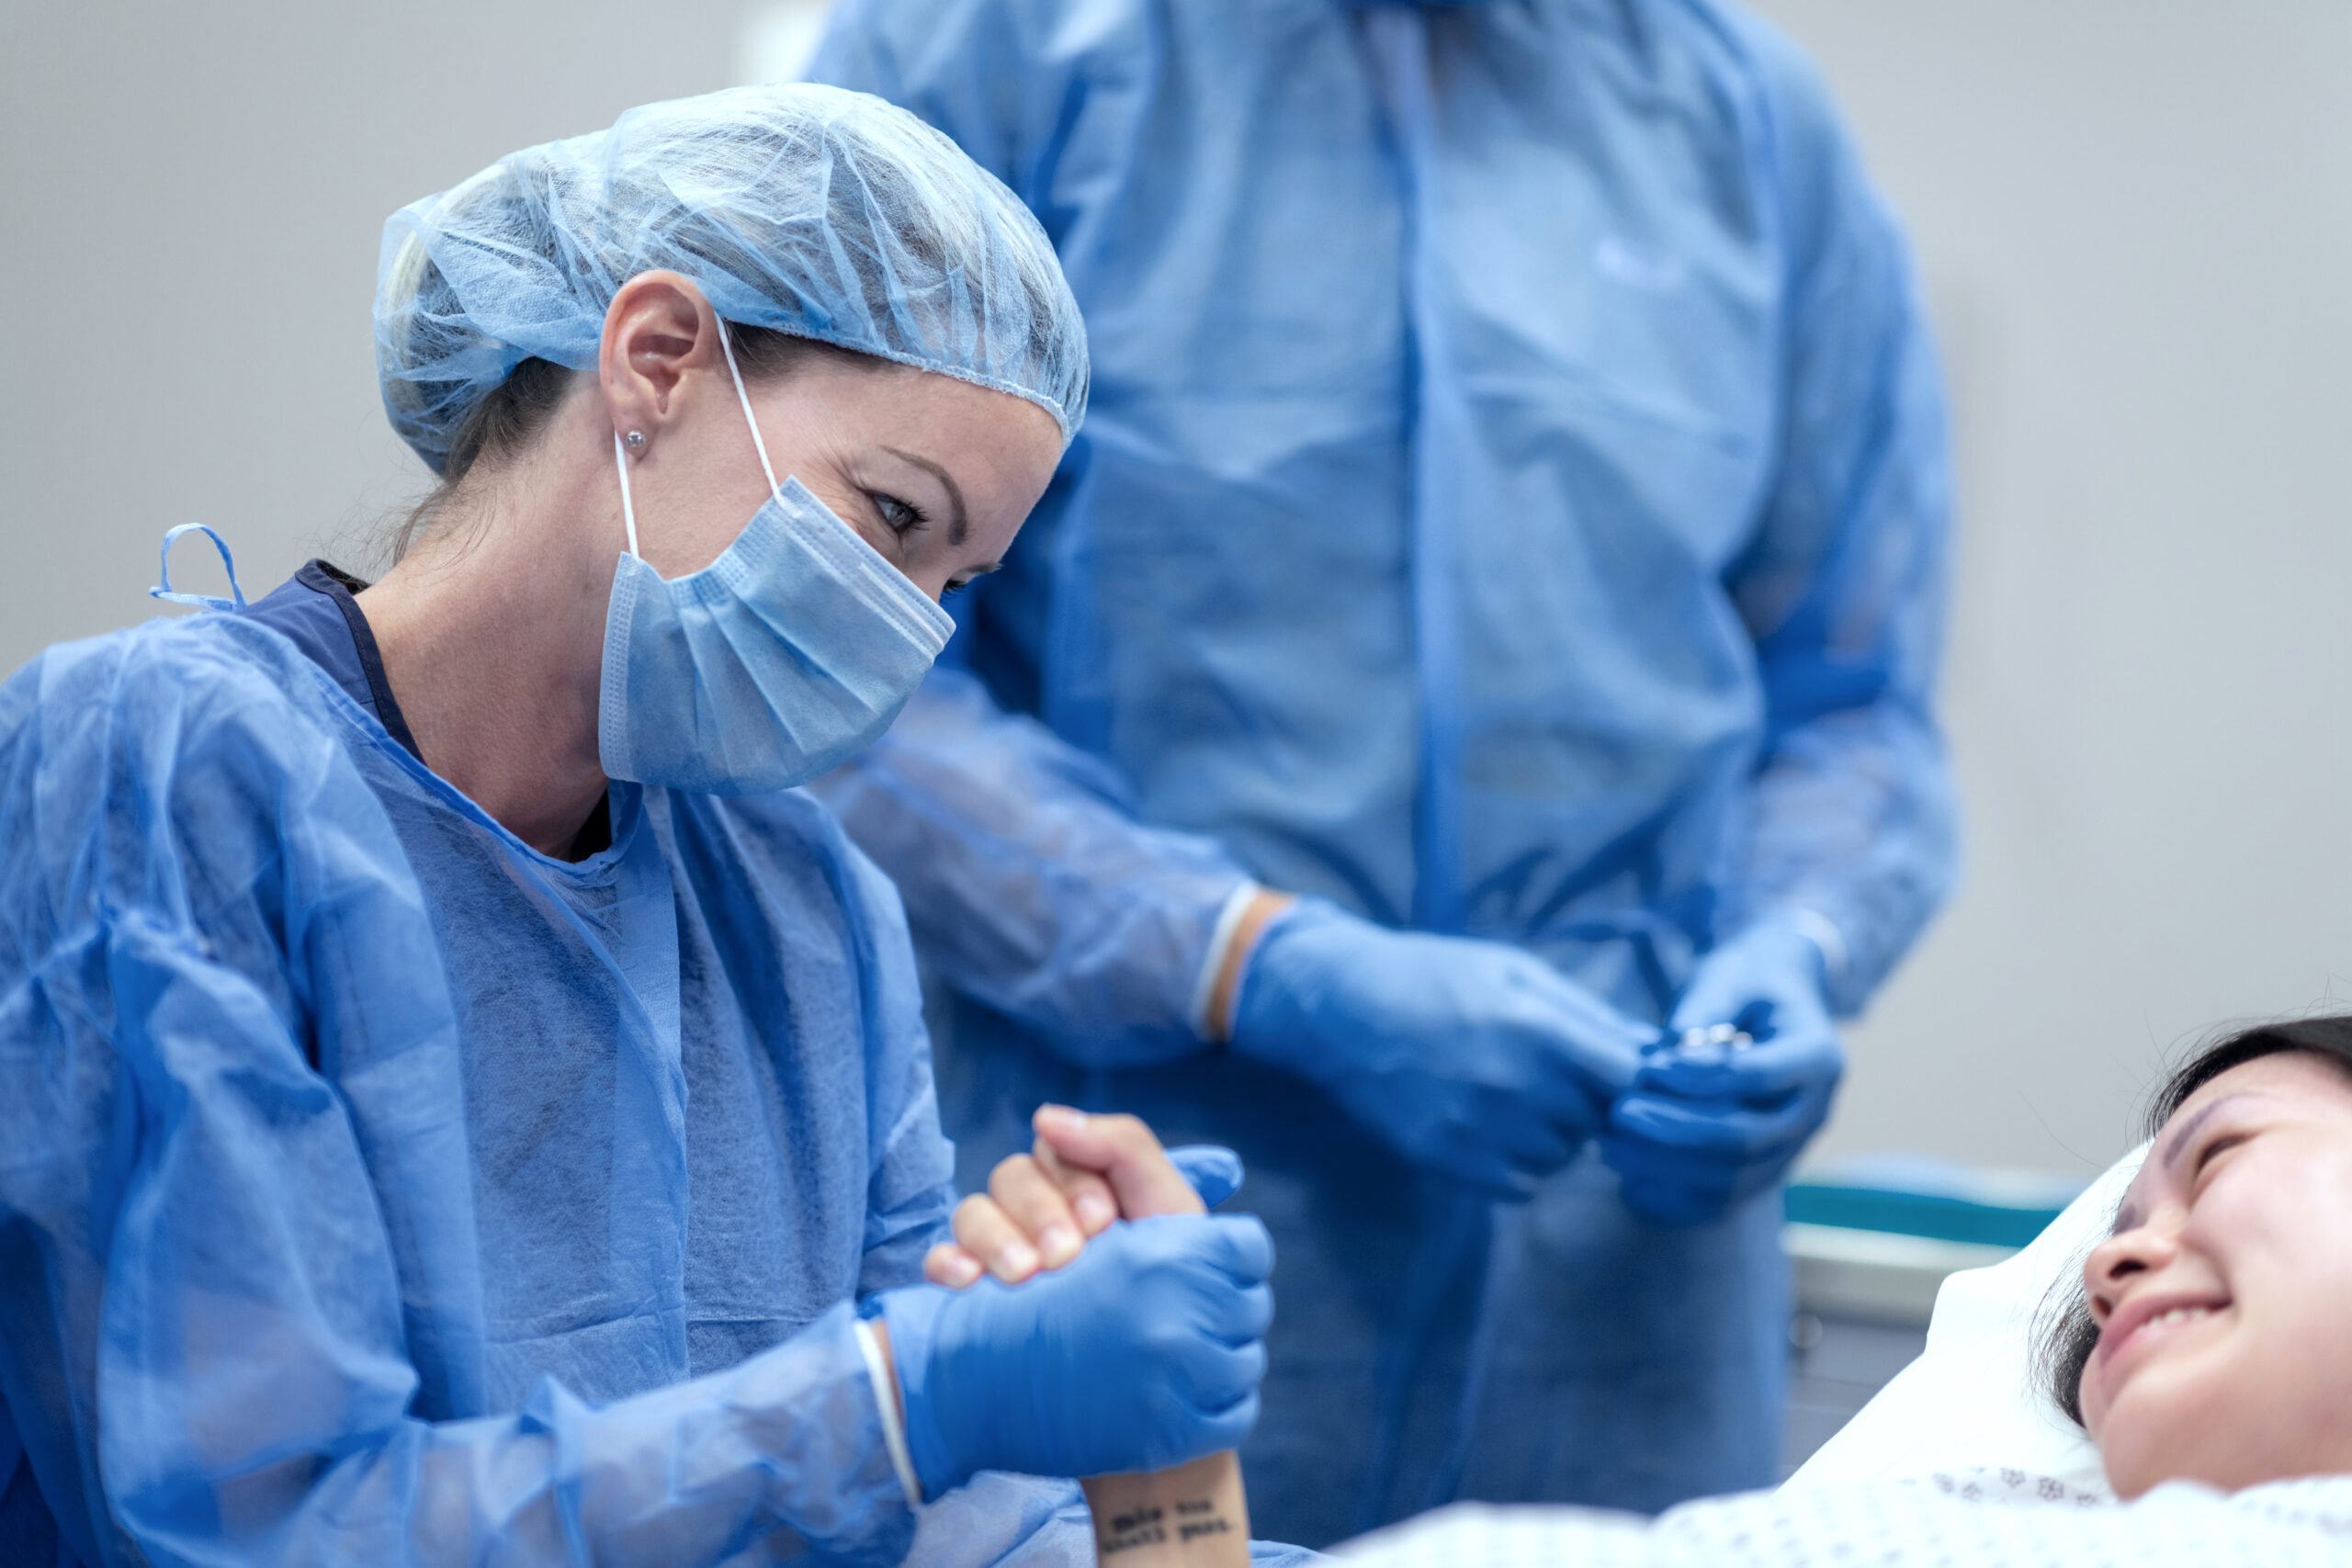
Today, we’d like to acknowledge all of our Anaesthetic Technicians and Registered Nurse Anaesthetic Assistants who work in our hospitals and day surgeries, ensuring the safety of those in our care during their most vulnerable moments. Anaesthetic Technicians play an important role in all procedures where anaesthetic is involved and are an integral member of […]
Read more
19 December
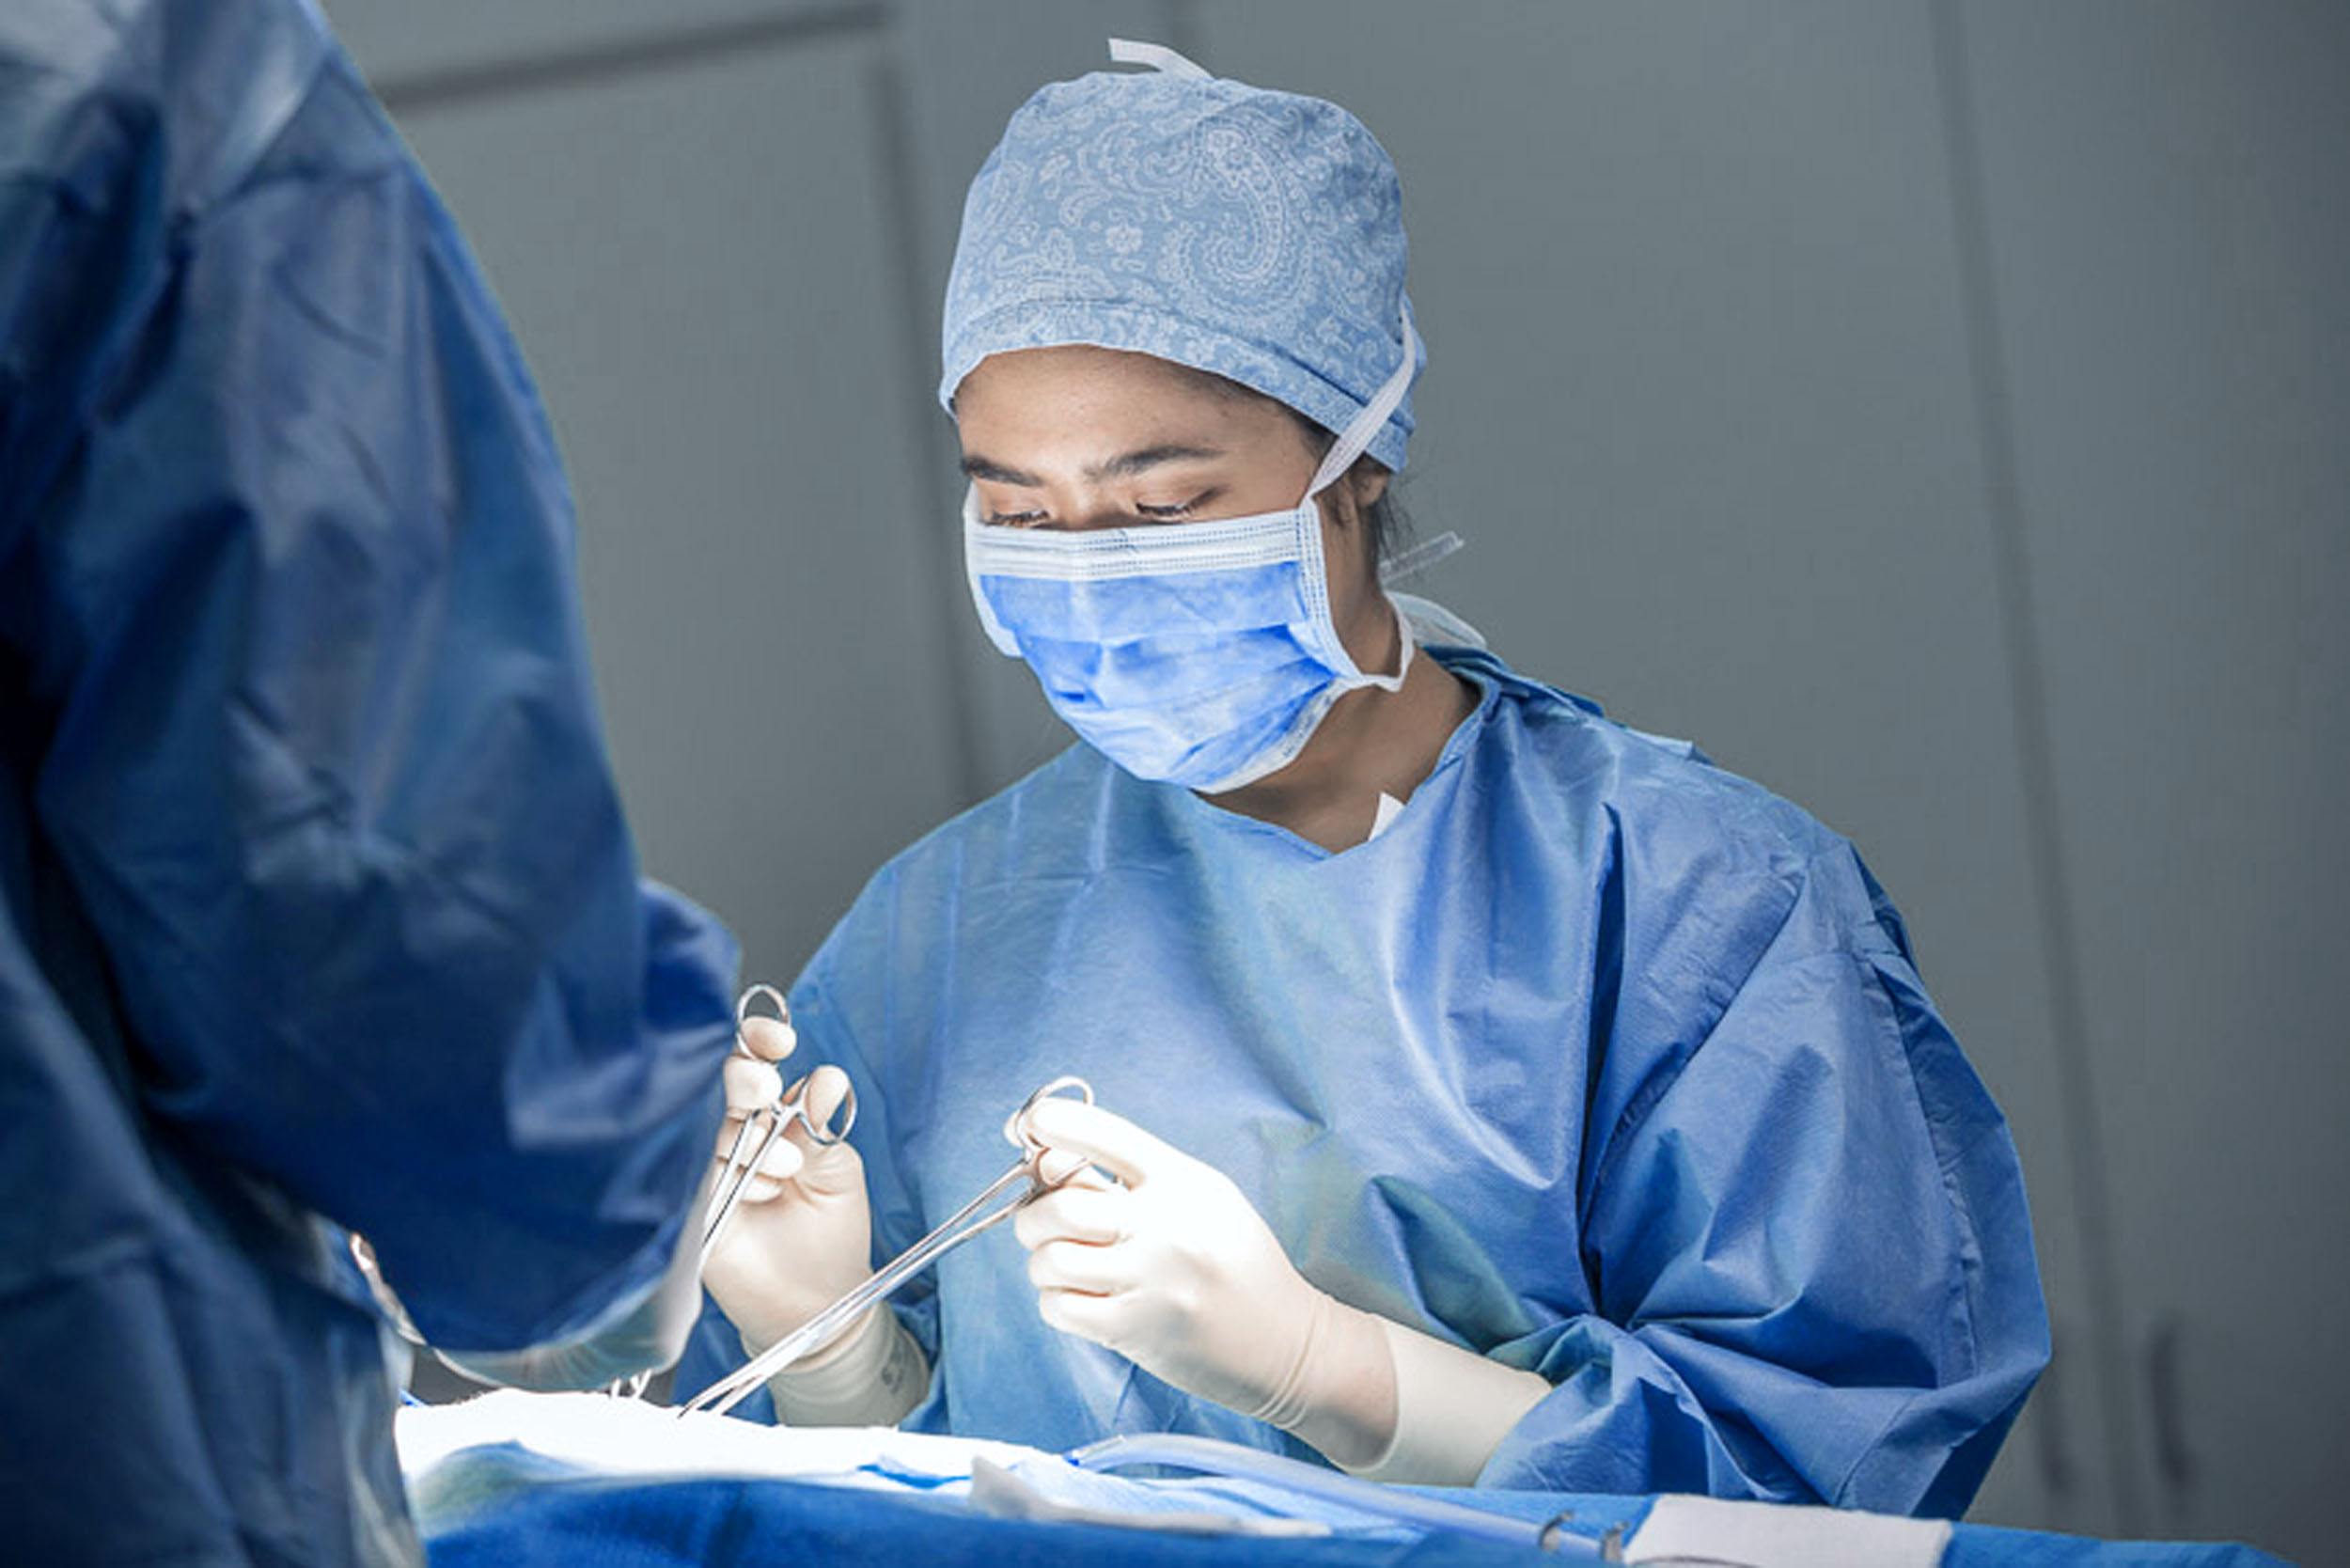
We’re pleased to announce that ABI Rehabilitation Services has now joined Evolution Healthcare Group as part of our Health & Wellbeing portfolio. With a team providing superior private healthcare services across Aotearoa, we’re leaders in the private healthcare space. ABI has a long history as the leading specialist brain injury rehabilitation service, providing intensive post-acute TBI […]
Read more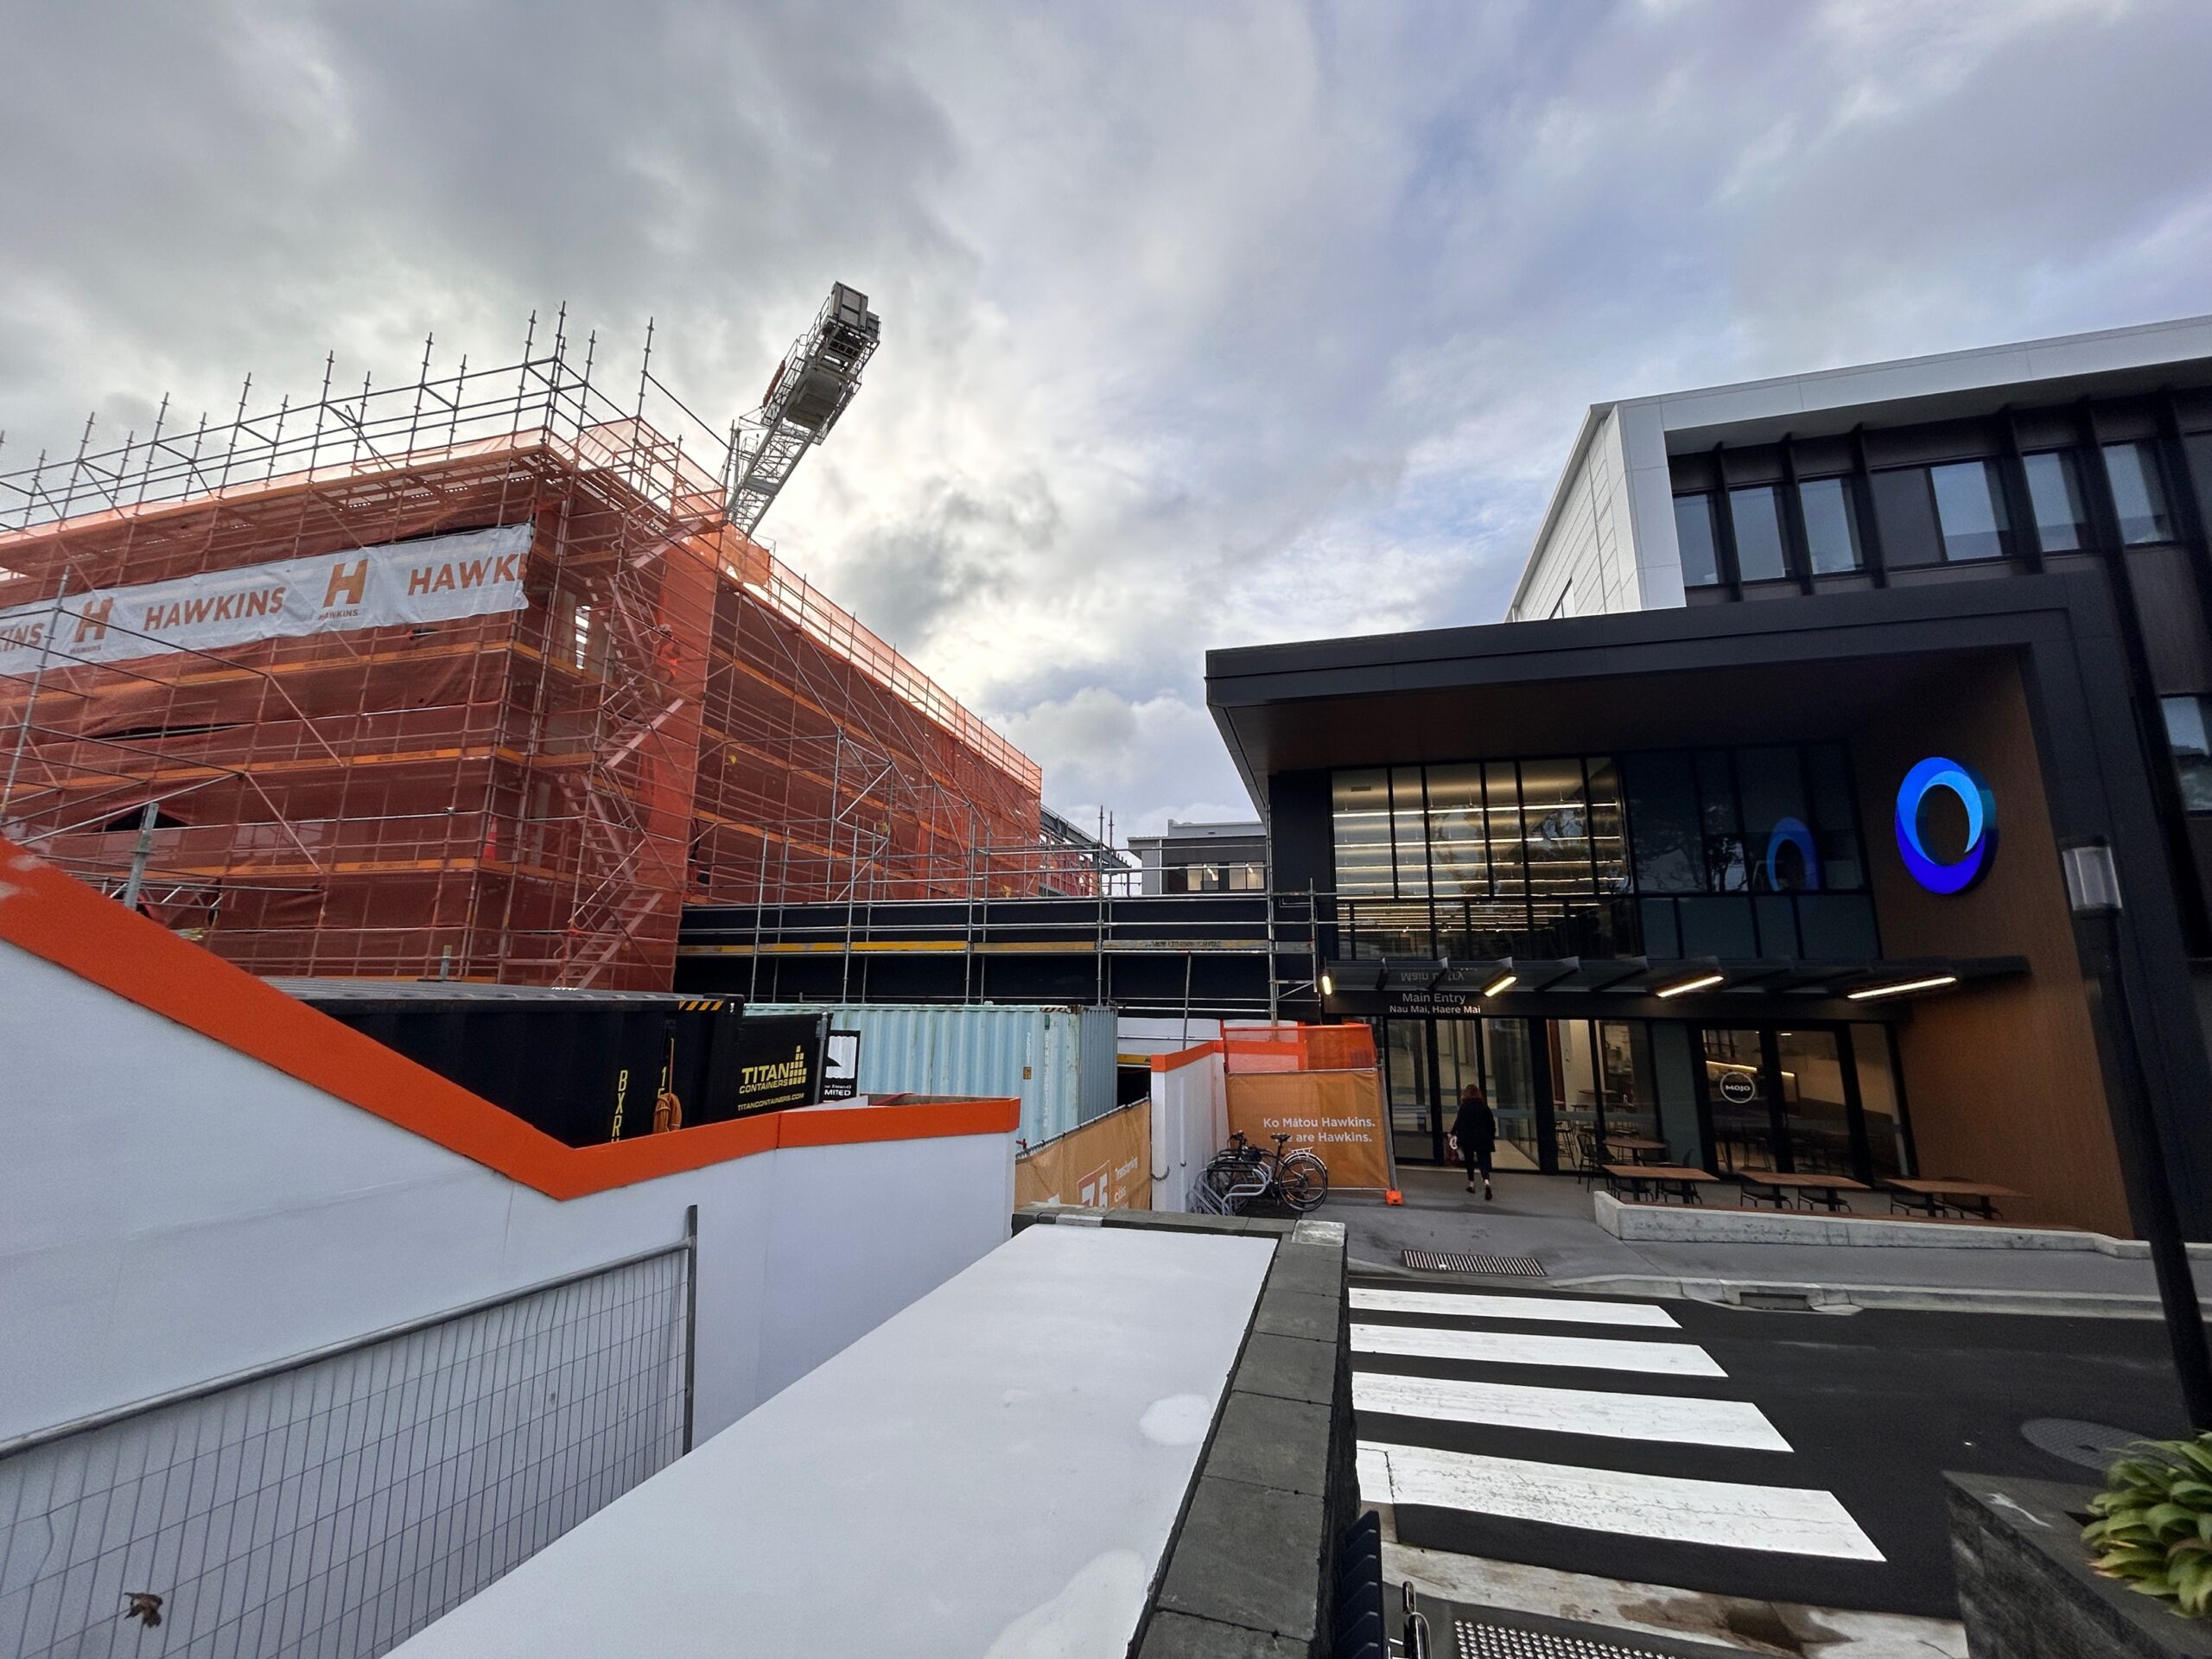
30 May
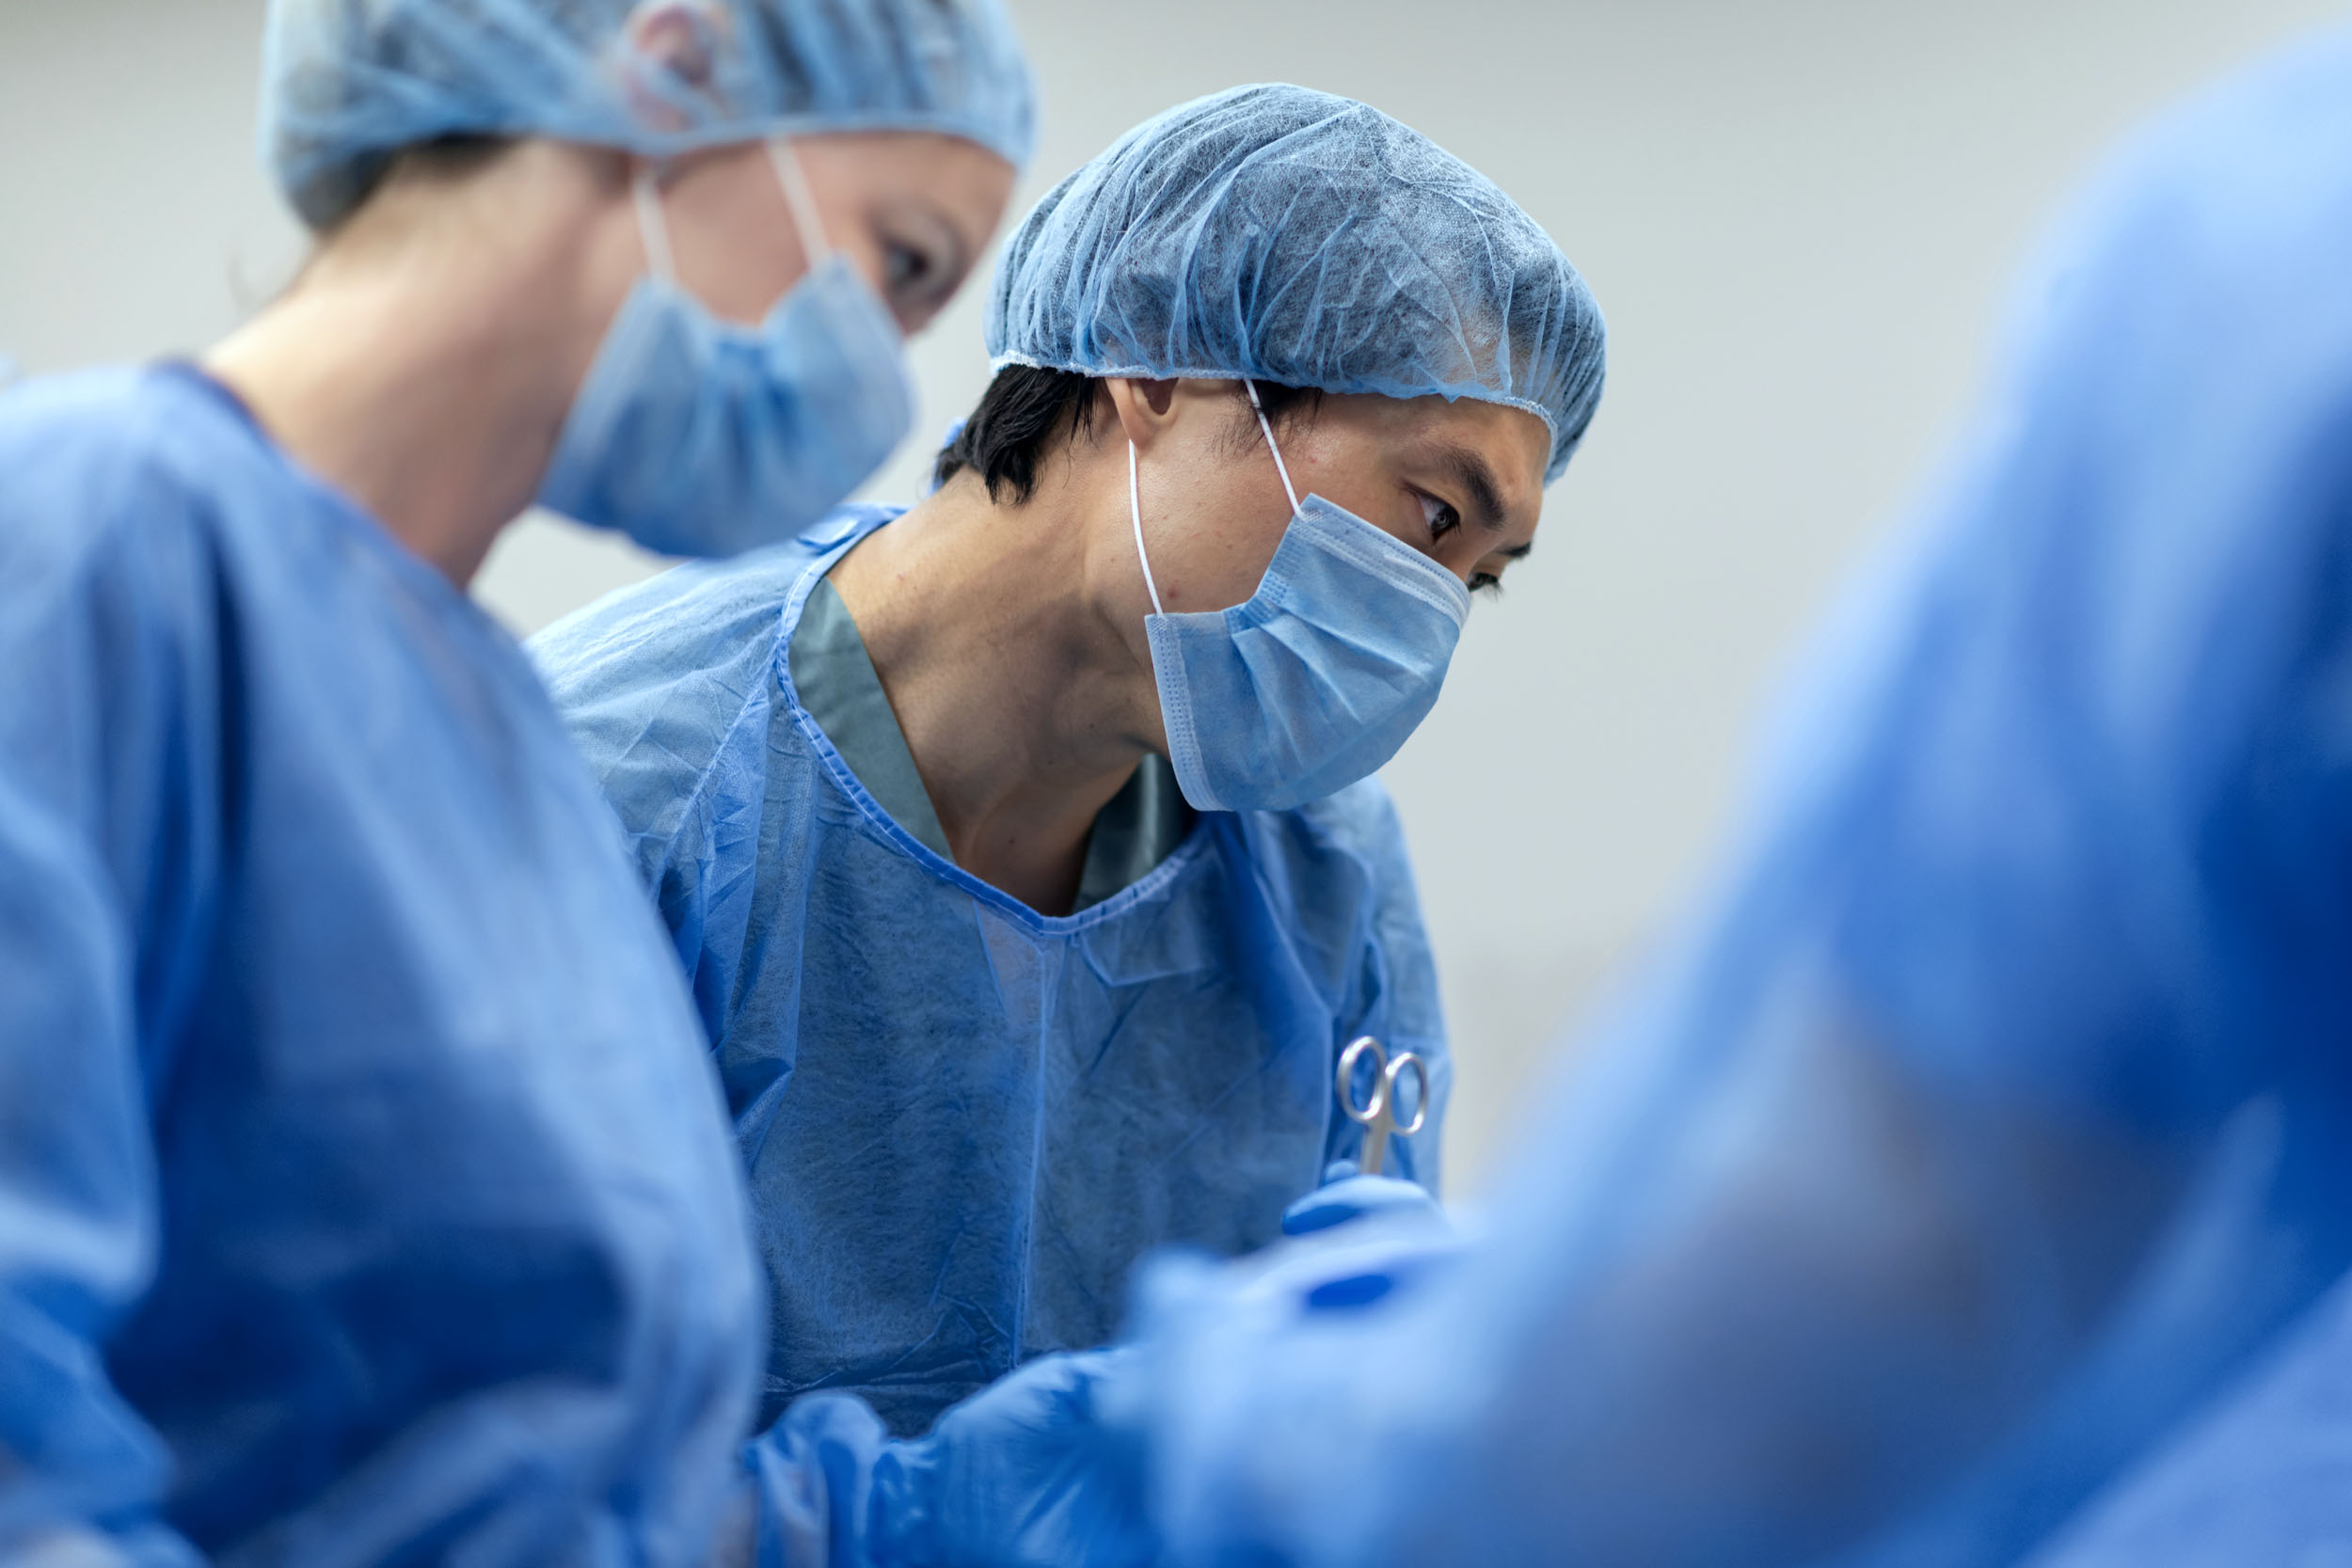
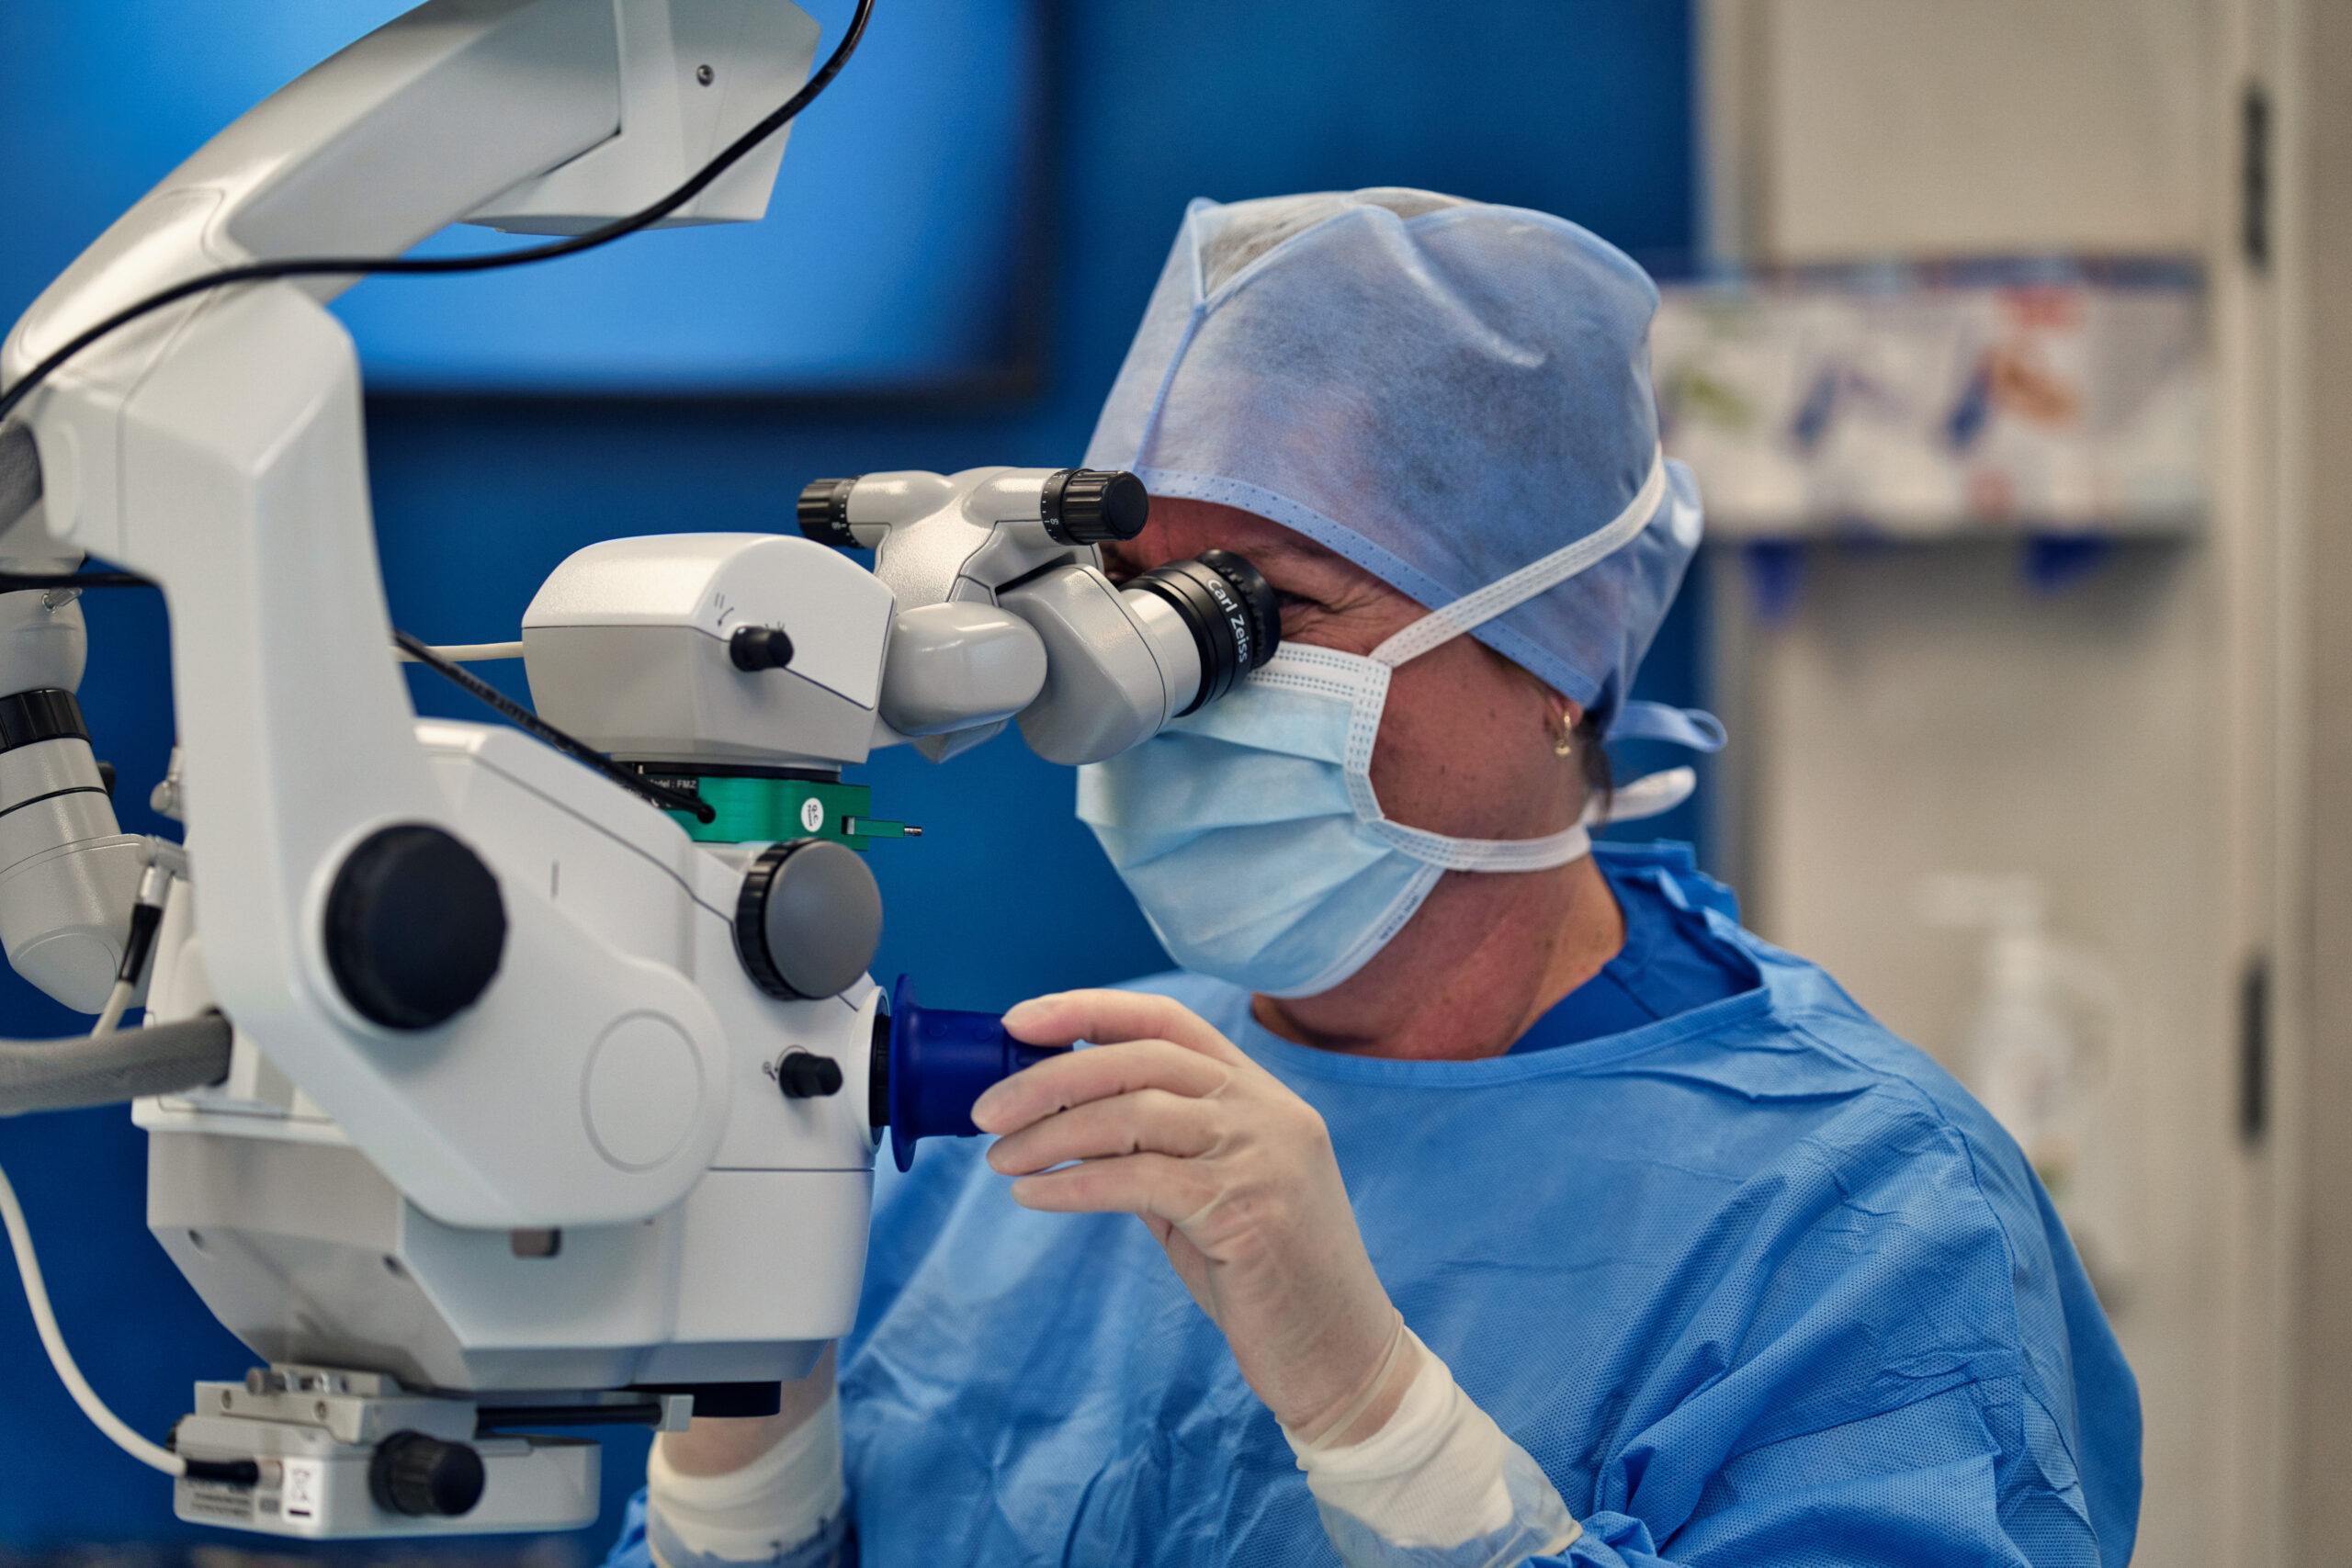
The second stage of Evolution Healthcare’s redevelopment of Wakefield Hospital is progressing smoothly. Stage 2 commenced in mid 2021 and the expected completion date is 2024. It will span five levels and will be home to a 37-bed inpatient ward, 10 ICU/HDU beds, cardiac cath lab, seven theatres, recovery areas, an endoscopy suite, reception and […]
Read more
30 March
Let’s give a round of applause to the real-life heroes in white coats! This National Doctors’ Day, we’re tipping our hats to the incredible doctors who dedicate their lives to healing and caring for others. Evolution Healthcare is honoured to work alongside these exceptional professionals who entrust their patients’ well-being to our facilities and services.
Read more
12 March
Today, we’d like to acknowledge all of our Anaesthetic Technicians and Registered Nurse Anaesthetic Assistants who work in our hospitals and day surgeries, ensuring the safety of those in our care during their most vulnerable moments. Anaesthetic Technicians play an important role in all procedures where anaesthetic is involved and are an integral member of […]
Read more
19 December
We’re pleased to announce that ABI Rehabilitation Services has now joined Evolution Healthcare Group as part of our Health & Wellbeing portfolio. With a team providing superior private healthcare services across Aotearoa, we’re leaders in the private healthcare space. ABI has a long history as the leading specialist brain injury rehabilitation service, providing intensive post-acute TBI […]
Read more
30 May
The second stage of Evolution Healthcare’s redevelopment of Wakefield Hospital is progressing smoothly. Stage 2 commenced in mid 2021 and the expected completion date is 2024. It will span five levels and will be home to a 37-bed inpatient ward, 10 ICU/HDU beds, cardiac cath lab, seven theatres, recovery areas, an endoscopy suite, reception and […]
Read more
Address